
Comparison Table - Overview
CompareMySolar is a comparison website for solar panels for your home. Based on your postcode, we show your real solar panel prices from local installers. All prices are updated by your local solar installers. You can compare your results based on variables that matter to you, whether that is price, installer experience, warranty or specific panel brands. We give you a unique tool that allows you to change results with the sliders and sort the outcomes by each table column.
You can request up to 3 solar panel quotes from our network of 100+ local solar installers, and personalize financial calculations for your own roof (get help about selecting your roof). We verify your solar potential and give our advice by phone. After your approval we send your information only to installers you select, who can schedule a site survey. Following the survey the solar installer makes a detailed quote that is unique for your home, and all detailed quotes are free and non-obligatory.
I need help with: Top 5 tips / Sliders / Table columns / Assumptions
Comparison Table – Top Five Tips
- Set your solar panel preferences using the sliders (e.g. 3.5-4.0 kWp)
- Refine calculations for your home using solar potential slider (e.g. 85%)
- Sort the results on any table column (e.g. price/wp)
- Check detailed calculations for 25 years (click on ’calculations’)
- Invite three installers to get a relative perspective of who is good
Comparison Table - Slider Settings
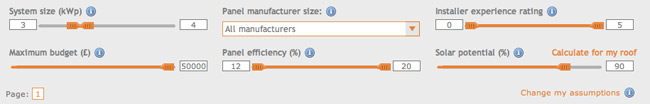
Above the comparison results table there are six sliders that allow you to set your search criteria:
| Slider | Explanation | Tips about usage |
| General Usage | Adjust sliders to state your preferences. Output table shows resulting solar panel system options from local installers. |
|
| System size (kWp) | Drag orange slider to change your preferred system size in kWp (kilo Watt-peak). Our system returns the most optimal system of this size only for each local installer. |
|
| Maximum budget (£) | Drag orange slider to change your maximum budget for the solar PV system |
|
| Panel manufacturer size | Here you can set the minimum company size (by annual production volume) of the panel manufacturer or select specific panel brands. You can use it as a proxy for warranty, as it can be important that your panel manufacturer will still exist in 20 years. |
|
| Panel efficiency (%) | Panel efficiency shows how much light from the sun is converted to electrical energy per square foot. High efficiency panels start at 16%, low efficiency is everything below 10% |
|
| Installer experience rating | The installer experience rating shows how much experience an installer has. Click on the logo of any installer in the list below to view all components of this rating. |
|
| Solar potential (%) | Select the estimated solar potential of your house from the table included based on the angle and orientation of your roof. Or click on ‘calculate for my roof’ to get an accurate potential |
|
kdkdkdk
Comparison Table - Table Columns
The comparison table shows a lot of information and can be overwhelming. Here are tips about each column:
![]()
| Table Column | Explanation | Tips about Usage |
| Local installer | Your local solar installer, click to see profile. |
|
| Price incl. VAT | Total price of the solar system (panels, inverter, installation). One-off local incentives (see assumptions) are deducted from this price. |
|
| Price / Wp | Price of the solar system per Watt-peak, serves as a good measure of the relative system price. |
|
| Electrical size | Electrical size of system in kilo-Watt-peak (1.000 Watt-peak). Measure of system output under standard testing conditions. |
|
| System output | Estimated yearly electricity output in kilo-Watt-hour (kWh) on your own roof rather than under standard testing conditions. |
|
| Year 1 payback | Money your solar system returns in the first year, sum of Feed-in-tariff, electricity savings and export tariff. |
|
| Payback time | Number of years after which your solar system has returned the initial investment. Heavily dependent on assumption of energy price inflation. |
|
| Profit in 25 years | Total profit you have received after a system has been working for the calculation period (default 25 years). Click ‘calculations’ to see details. |
|
| #, Wp, efficiency | Solar panel information: the manufacturer, the number of panels, the size of each panel in Watt-peak, the efficiency of each panel. Click to see spec sheet. |
|
| Distance | The distance in miles to the installer. |
|
| Years warranty | Years of warranty on the installation as provided by the installer. |
|
| Experience rating | Installer experience rating shows how much experience an installer has. Click on the logo of any installer to view all components of this rating. |
|
| Request quote | Click Quote to enter your details and request a free and non-obligatory detailed quote from the selected installer. |
|
Comparison Table - Other Assumptions
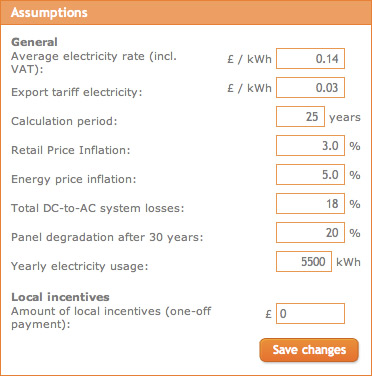
Besides the sliders and table columns there are some advanced assumptions that impact your calculations:
| Assumption | Default setting & rationale | Tips about Usage |
| Average electricity rate (incl. VAT) | £0.15 / kWh – based on average cost for UK consumers (DECC) | Set to your own average cost / kWh (or your daytime rate) |
| Export tariff electricity | £0.045 / kWh – set export rate valid for all electricity suppliers | Using your electricity in your house returns 5 times more than exporting to the grid |
| Calculation period | 25 years – industry standard | Solar panels have an average lifetime of over 30 years |
| Retail Price Inflation | 3.0% - UK average (10 years) | Used to adjust the Feed-in-tariff rate in yearly calculations |
| Energy price inflation | 5.0% - Conservative estimate based on 7% average (10 years) | Used to adjust the electricity savings in yearly calculations |
| Total DC-to-AC system losses | 18% – industry standard | Losses from e.g. cables, inverter and small debris |
| Panel degradation after 30 years | 20% – industry standard | Most manufacturers guarantee 90% after 12 years, 80% after 25 |
| Yearly electricity usage | 4000 kWh – based on a 2 bedroom house (DECC) | Used to calculate electricity savings, all kWp generated are preferably used in your house (up to yearly usage) |
| Amount of local incentives (one-off payment) | £0 – Local incentives not common in UK | Check with your local council if specific arrangements exist |